
Firstly, to access the Analytics dashboard of your Campaign, select the “Campaign Overview” button.
From here, you will be brought to the Overview dashboard of your campaign which will show you 3 sub-tabs;
- Overview
- Submissions
- Analytics
Select the Analytics sub-tab to begin navigating through your Campaign's collected data.
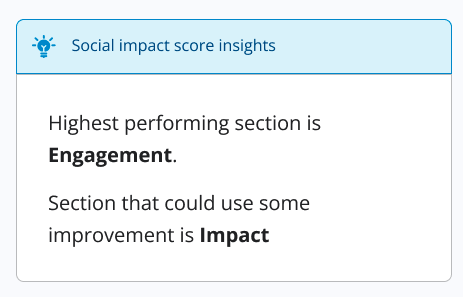
When you land on the Analytics page, you’ll find the following information available to you, allowing you full visibility on how well your campaign is performing, along with insight on how you can improve your form's overall performance!Each of the above sections of the Analytics page will include an Insights section. Insights are recommendations provided by the New/Mode platform based on the following criteria:
- Previously successful campaigns run using the New/Mode platform
- Industry standards & best practices
- Tips and tricks from advocacy professionals
Impact Score
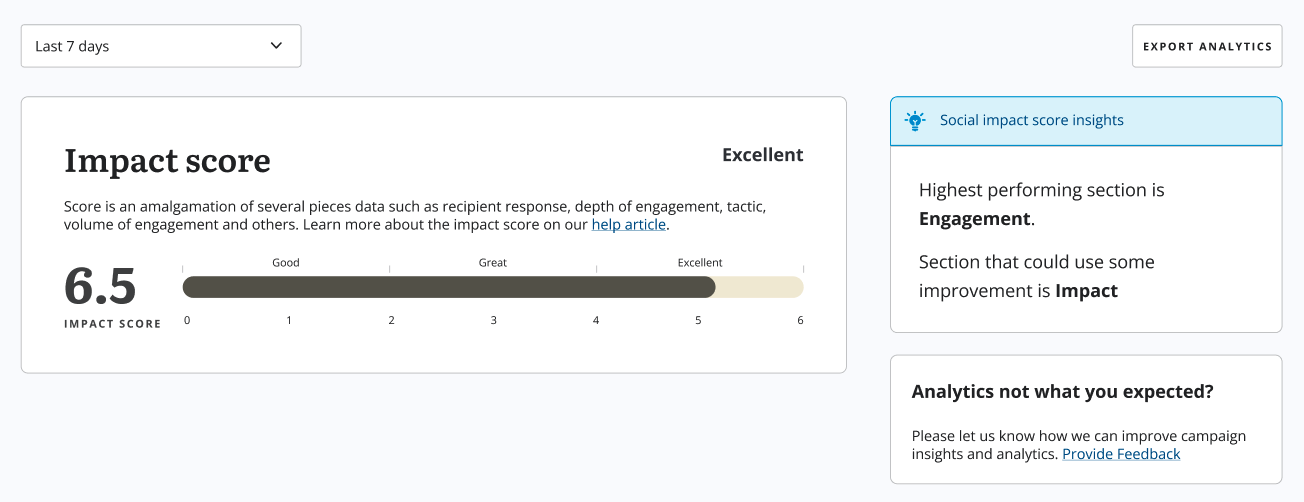
What is an Impact Score?
The Impact Score is a scale that is provided to show you how well your campaign is performing.
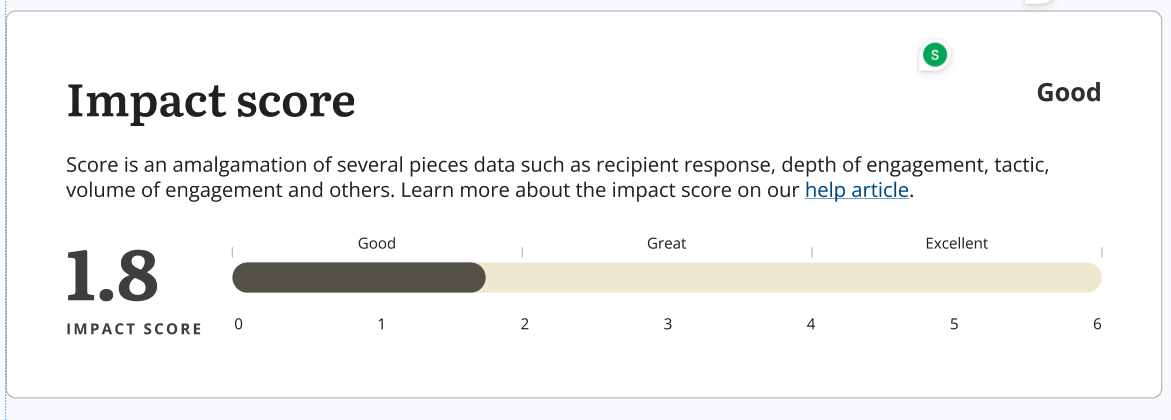
The score sits on a scale between 0 and 6. This means that if your campaign's score is sitting at the lower end of the scale, it might be in your best interest to review your campaign's current strategy!
This score is calculated based on the statistics of previous campaign successes and failures. The accumulated data is then used to predict your campaign’s overall impact! Our Insights section will then provide advice on how you might be able to improve the Impact Score for your campaign.
Engagement
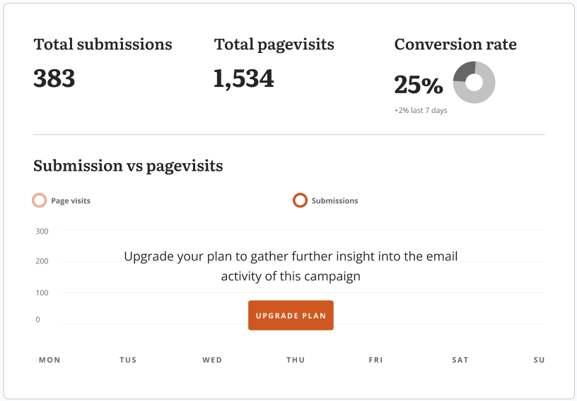
The Engagement section of your Analytics provides you with the raw data collected from your campaign. This section of your Analytics is compiled into four different parts:
- Total Submissions
- The total number of supporter submissions that have been collected on your Campaign
- Total page visits
- The number of users who have visited your form since its launch.
- Conversion Rate
- This percentage shows you how many of your users are taking action on your form. This percentage is calculated by taking the total number of users who submit on your Campaign and dividing it by the total number of visitors.
- Submission vs. Page Visits
- This graph gives you a visual of the comparison between the total number of visitors on your form alongside the users who have submitted to your campaign.
The Insight card on the Engagement portion of your Analytics will provide recommendations and useful tips that will positively impact your Engagement statistics.
Outreach
The outreach section provided on the Analytics tab of your Campaign is to give you a better picture of how and where your supporters are interacting with your action. This section of the Analytics page is only available for Grassroots users and above. If you're hoping to gain access to this section of your Analytics, you can check out our available subscription options here!
The Outreach section covers two segments of data:
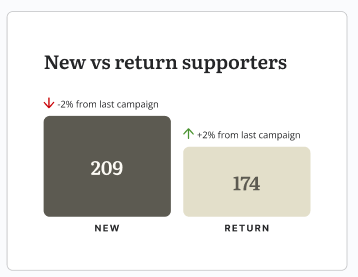
- New vs Return Supporters
-
This card will show you how many of the supporters who are interacting with your Campaign are new users, or if they are returning supporters who have already taken action on previous Campaigns that you have run.
-
- Supporters Location
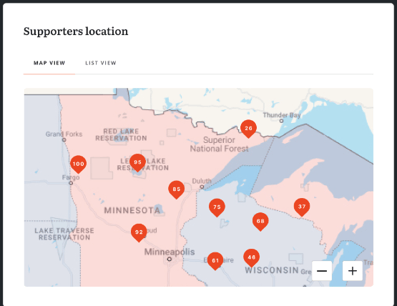
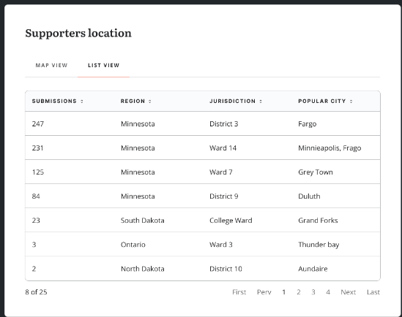
- This card provides you with two sub-tabs: a map view and a list view of supporters based on their input location when taking action on your Campaign!
- Map View - This is a map that pinpoints the locations of your supporters who have taken action on your Campaign. Each pin will give you a count of how many supporters have come from that location on the provided map.
- This card provides you with two sub-tabs: a map view and a list view of supporters based on their input location when taking action on your Campaign!
-
-
- List View - This is the same supporter's location data that can be seen in the map view above, but it provides it in a detailed list format. This list view is broken into the following columns; Submissions, Region, Jurisdiction, and Popular City.
-
With the Insights card, you'll be given recommendations on how you can improve the above statistics provided by our Outreach section!

Impact
The Impact segment of your Analytics gives you a breakdown of the, you guessed it, impact of your overall Campaign! This data is split into four different cards within this section which we have broken down below to provide more context on the provided information.
- Recipients Reached
- This is the total number of recipients who have been reached on your form. For example, using the above image as a reference point, if 500 possible recipients can be targeted from your action, this data will show you the total number who have been reached out of that 500.
- Recipients Open Rate
- This is the total number of recipients who have opened letters that have been sent to them from your Campaign.
- Email Activity
- A graph that provides a visual of how many emails have reached your intended recipients compared to the number of times that they have opened the received letters.
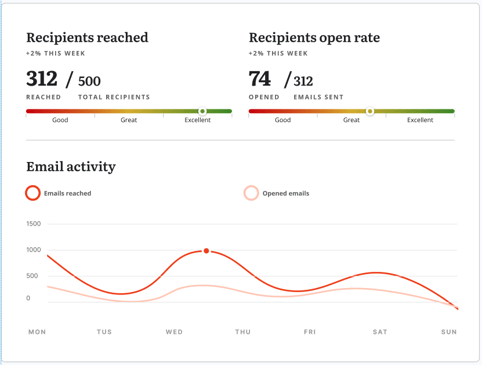
- A graph that provides a visual of how many emails have reached your intended recipients compared to the number of times that they have opened the received letters.
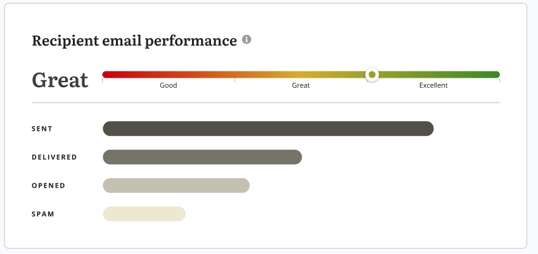
- Recipient Email Performance
- This graph provides you with an in-depth look at how your deliverability has been performing over the course of your Campaign. At the beginning of this card, you will see that you are provided with a scale that will give you a generalized summary of your Campaign's email performance. Below this scale, you'll see that the email performance is broken into 4 segments:
-
-
- Sent - The total number of emails sent from your Campaign
- Delivered - The number of emails that have been received by your recipient's mail domain
- Opened - How many of these delivered emails have been opened by your intended recipients
- Spam - This will show you how many emails have been flagged as spam by your recipients.
-
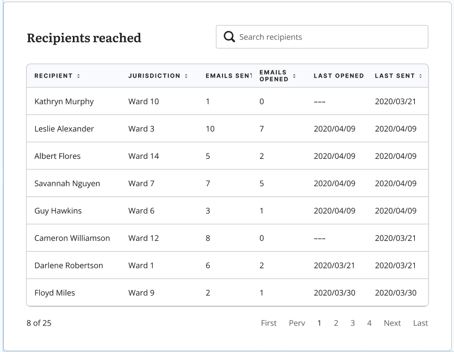
- Recipients Reached
- This is a listed view of all of the recipients that have been targeted during the entirety of your Campaign. This section of our analytics is only available for our Grassroots plan users.
- This listed view includes:
- The recipient's jurisdiction
- The number of emails they have been sent from your Campaign
- How many emails have been opened
- The last time an email from your Campaign was opened by a targeted recipient
- The last email that has been sent to the specific recipient from your campaign.
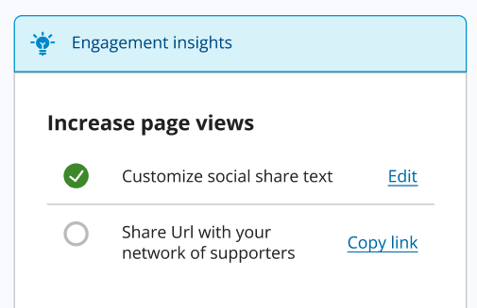
- Insights
- The final card provided in the Impact section of your analytics is the Insight segment. This is here to provide you with helpful recommendations on how you can improve the overall impact of your campaign. These improvements will include tips and suggestions like the ones seen in the image provided below,

Feedback
Is the Advanced Analytics & Insight feature not what you were hoping for? Let us know here if there are any changes you’d like to see made to this feature as the New/Mode platform continues to improve!